What is Insight Matrix?
Insight Matrix can be characterized as an Agglomerative Hierarchical Algorithm utilizing Centroid Clustering and Squared Euclidian Distance to produce a Dendrogram.
SAY WHAT???
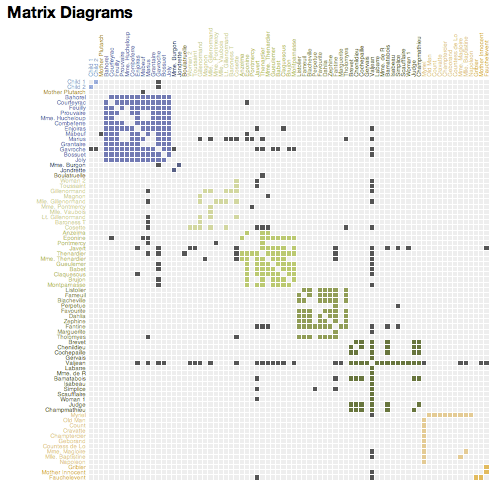
Okay, lets back up. Insight Matrix is a tool, written by Vijay Kumar and Brandon Schauer at the Institute of Design, for finding patterns in research data. Specifically by clustering a list of similar items into distinguishable groups. It does this by asking the user to score the relationship between the items on the list. When used for analysis, this score should have supporting evidence. Each cell in the matrix is then populated with a value expressing the relationship between the row and column items. This creates a "profile" for each item. To read this profile, just read across the row or down the column. As the matrix is sorted, the order of of cells in a row or column will change, but never the contents. In fact, the sorting component of Insight Matrix is purely visual, it has no bearing on the actual clustering. The point of all this is to help discover groupings of related items that are non-obvious. Once clustered, it is up to the user to discover the common meaning of the group.
Where did it come from?
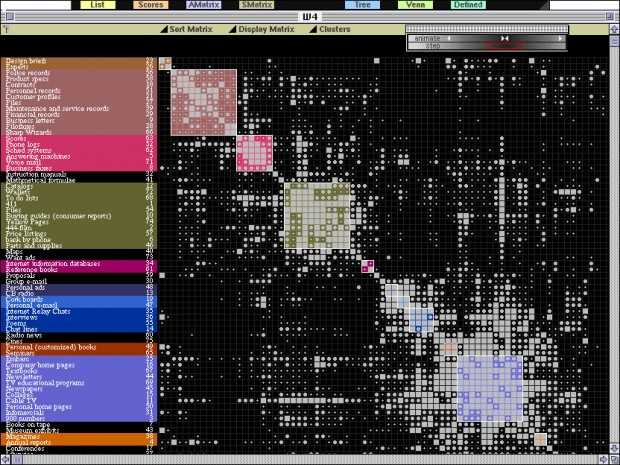
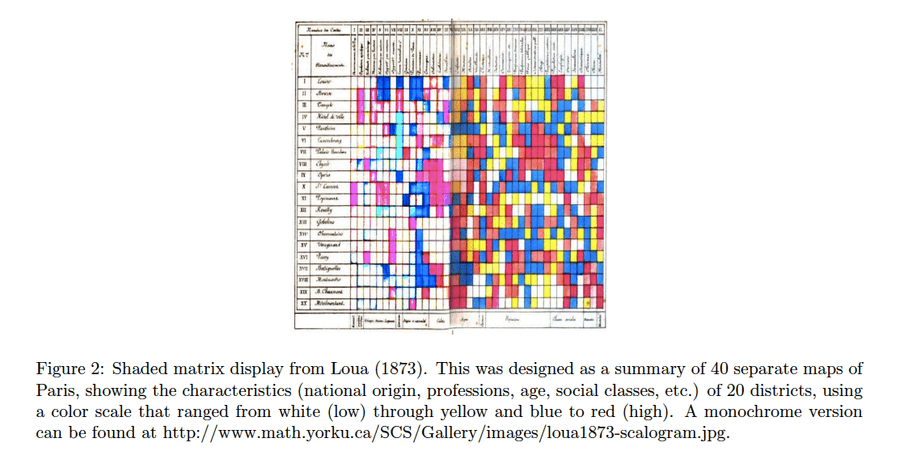
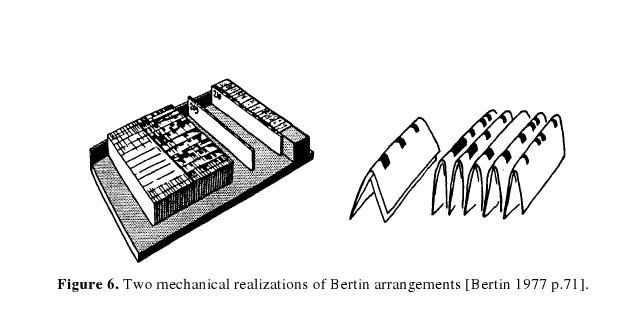
The oldest example I could find came from T. Loua in 1873. Loua shaded the cells of a matrix with different colors to express the relationships in Parisian social statistics. (Wilkinson, 3) In the modern era, the genesis of these techniques occurred post-WWII, when science began generating massive data sets that were not easily analyzable by traditional means. In 1963 Sokal and Sneath published "Principles of Numerical Taxonomy" that, coupled with the availability of computers, triggered an explosion of research into clustering algorithms. Sokal and Sneath were interested in creating a taxonomy of organisms by clustering them according to their features, but others saw many other uses. (Aldenderfer, 8) Having witnessed Jay Doblin cluster data on paper, and Jacques Bertin use a system of wooden blocks with holes through two axis to allow sorting of rows and columns, Vijay Kumar recognized the need for a computer algorithm in design. In 1994, Vijay Kumar wrote Analysis & Transformation (A&T) at Doblin for design research analysis. This original precursor to Insight Matrix was written in SuperCard, an enhanced version of HyperCard. It was later adapted to Microsoft Excel with the help of Brandon Schauer at the Institute of Design in 2004.
Where else are these used?
Similar algorithms are found all over the place in the social and biological sciences. Wikipedia states, "Clustering is a method of unsupervised learning, and a common technique for statistical data analysis used in many fields, including machine learning, data mining, pattern recognition, image analysis and bioinformatics" (Cluster Analysis). In these fields however, the data set is generated by means other than scoring, and cluster analysis is then applied to it for the purpose of accelerating pattern finding or automatic classification. These tools are generally tailored to the specific kind of data being analyzed. Hence the creation of Insight Matrix, a clustering tool designed specifically for designers. It should be noted that novel uses for cluster analysis are being found everyday. Furthermore, there are no "right" answers regarding cluster analysis. Newer, faster algorithms are born everyday. The point is to understand how they behave so we can select the best one. Hopefully this paper will shed some light on the matter and generate some interest in the topic.
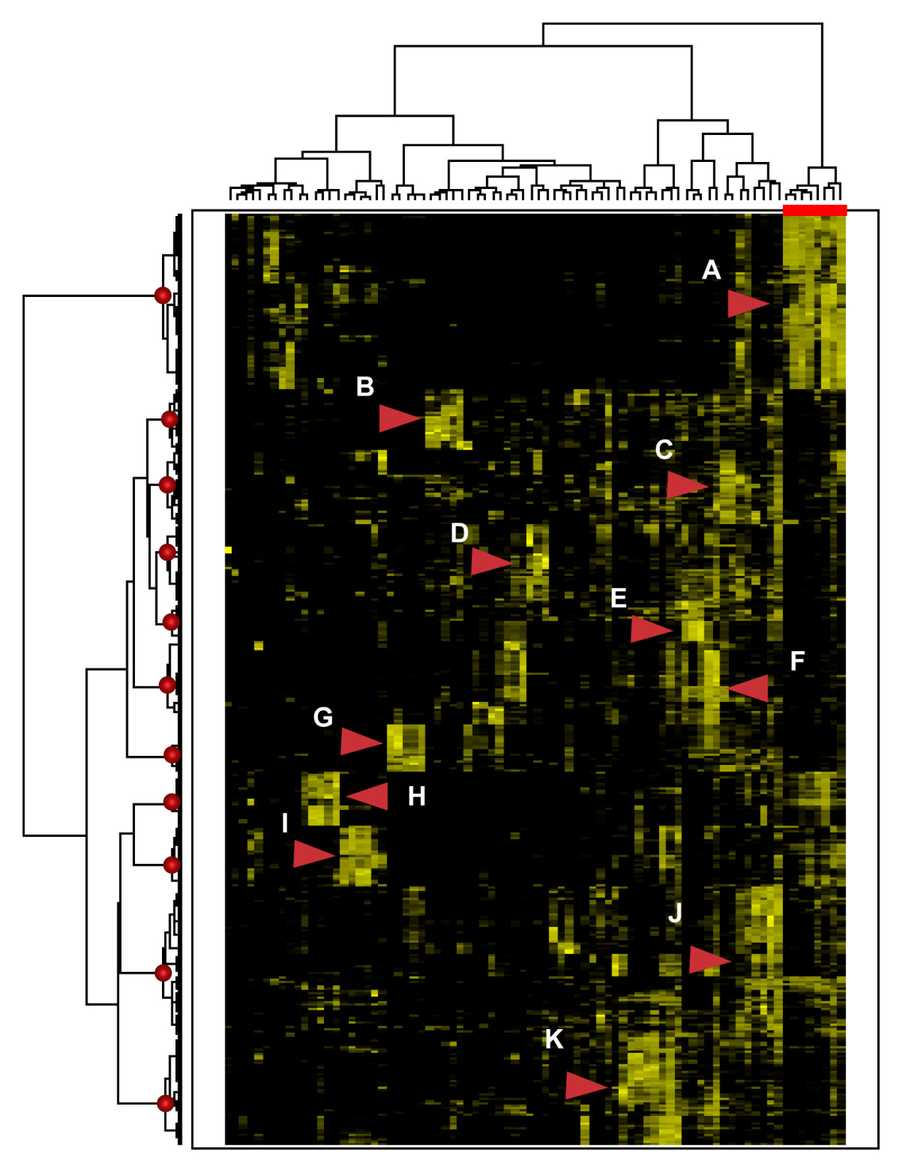
Okay, enough history, how does this thing work?
To start, Insight Matrix, and many clustering methods, actually utilize two algorithms, in this case: Centroid Clustering and Squared Euclidian Distance. The first algorithm is used to determine WHAT to compare. As items are grouped into clusters there are several ways to compare the resulting clusters. Insight Matrix uses centroid clustering. Meaning, as items are clustered into groups, that group is represented by a new single item, a centroid, which is the average value for all the items in the group. Distance is then computed to this new average item. At first this is a trivial step since clusters are composed of individual items, and any item is the average of itself. As clusters are formed the algorithm for comparing clusters becomes important.

One benefit of centroid clustering is that it "is a compromise between the sensitivity of complete-link clustering to outliers [in the cluster] and the tendency of single-link clustering to form long chains that do not correspond to the intuitive notion of clusters as compact, spherical objects." (http://nlp.stanford.edu/IR-book/completelink.html) However, centroid clustering may not create optimal clusters at every step. This is important because it can cause some distortions in the clustering. As items form clusters, the distance between these islands should increase at every step. Centroid clustering may cause clusters to move towards each other, a violation of a basic premise of clustering algorithms. (http://nlp.stanford.edu/IR-book/html/htmledition/centroid-clustering-1.html) Insight Matrix will not highlight when these inversions occur, but you should be able to visually check that every item belongs in the group. You may find non-intuitive clusters and should feel empowered to make minor changes where necessary. Generally, if something seems off, both conceptually and visibly, don't include it in the cluster. We accept these quirks because of the conceptual simplicity of the algorithm.

The remaining question is how to measure the distance between the centroids. The first algorithm, an averaging algorithm, told us WHAT to compare. The second algorithm, a squared Euclidian distance algorithm, tells us HOW to compare the WHAT. This second algorithm computes a the distance between every item in the list. In Euclidian distance, the distance between two items is "as the crow flies"(http://en.wikipedia.org/wiki/Euclidean_distance). In this case, a squared Euclidian distance algorithm is used to avoid the need for a square root. (Aldenderfer, 24) While squared Euclidian distance magnifies the difference between distances, this amplification is not a significant distortion since Insight Matrix uses a standardized scoring system. Thus, everything will be equally amplified, relatively speaking.

Once the distance measures are computed, Insight Matrix selects the pair with the shortest distance between them and clusters them. In the case of ties, they are merged in random order. By doing this process repeatedly the items are clustered into higher order clusters at each pass. This is called pairwise agglomerative clustering, as opposed to divisive clustering. In divisive clustering, one starts with one cluster and successively splits it into sub-clusters. Either one can be used to produce a binary tree, or dendrogram. For us this means that only two items are ever clustered at one time, never more. Note that when interpreting clusters, the central pair of the cluster is not always the most connected. Rather, the earlier the items are merged the more they are related. In general, the further apart the items the more dissimilar.
Clustering algorithms are programmed to stop clustering "either when the clusters are too far apart to be merged (distance criterion) or when there is a sufficiently small number of clusters (number criterion)". (http://en.wikipedia.org/wiki/Cluster_analysis) Insight Matrix stops clustering when there is only one cluster, so be cautious when ascribing meaning to final step clusters. These last groups may be very dissimilar, and may not be meaningfully connected. Visually check the matrix to be sure the these last clusters are relevant.
How fast do these algorithms run?
There have been several breakthroughs in the past couple of years with Euclidian distance, and it can now be computed in O(N) time. Where N=n^2 for an nxn matrix. (Lucet) However, you can generally calculate the speed of both these algorithms to be O(NlogN) in their standard implementation. Suffice to say for those who did not catch that, clustering the maximum sized matrix in Excel will take at most a few hours on a modern computer. If you are making insight matrices that big, it might be time to invest in a different tool.
Additional Resources
Bertin, Jacques. Translated by Berg, William J. and Scott, Paul. "Graphics and Graphic Information Processing". Walter de Gruyter & Co., New York, 1981. http://www.resample.com/xlminer/help/HClst/HClst_intro.htm http://nlp.stanford.edu/IR-book/html/htmledition/irbook.html http://citeseerx.ist.psu.edu/viewdoc/download?doi=10.1.1.165.4766&rep=rep1&type=pdf http://en.wikipedia.org/wiki/Cluster_analysis http://www.math.yorku.ca/SCS/Gallery/bright-ideas.html
